
Doing the best for nature
Inspired by George Hipp's pioneering commitment to organic farming in 1956, we remain dedicated to nurturing a brighter, more sustainable future for our children and our planet.


What “Doing the best for nature” means at HiPP
Doing what’s best for nature is at the heart of everything we do. Here’s a quick look at some of the key areas we focus on. Want to go deeper? Our latest Responsibility Report has the full story.
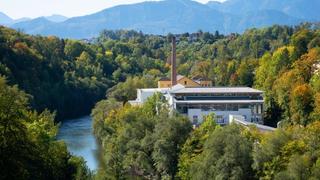
Continuously improving to reduce environmental impact
At HiPP, we have a long history of taking meaningful steps to reduce our impact on the environment, and we know there is always more to do. Our approach to responsible manufacturing is built on real progress, transparent reporting, and clear goals for the future.
We will continue taking meaningful steps to reduce our impact on the environment in the future through our 10-year roadmap to reduce Scope 1 and Scope 2 greenhouse gas emissions by at least 40% at key production sites. Plus, investing in greener logistics, reduced packaging and energy efficiency to go further, faster.
We’re proud of our achievements:




Caring for the next generation is in our nature
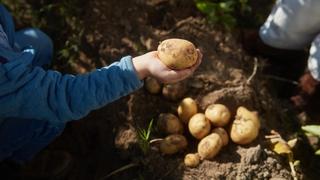
HiPP has been a pioneer in organic farming for nearly 70 years. In 1956, when Georg & Anny Hipp went against the agriculture norms of the time, they were inspired and driven by their belief that growing baby food without chemical fertilizers or pesticides was better for babies and the environment.
Today, HiPP is one of the world’s largest processors of organic raw materials, sourcing and handling around 150,000 tonnes every year. We go beyond the minimum EU organic certification standards, applying our own HiPP Organic seal and setting strict internal requirements to ensure exceptional safety & quality, especially for infants.
HiPP Organic products are certified under the EU Organic Regulation and the OF&G (Organic Farmers & Growers), reflecting our deep commitment to organic integrity.
Our organic principles include:
No synthetic pesticides or fertilisers – ever.
Soil regeneration through composting and humus development.
Circular farming practices that enrich ecosystems.
A global push to make organic the gold standard for baby food.
Where farms become habitats
Nature thrives where HiPP farms.
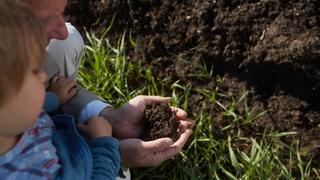
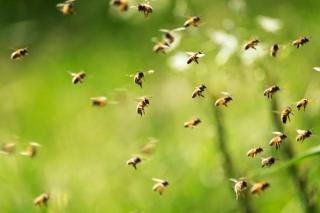
HiPP’s approach to farming places a strong focus on encouraging biodiversity. By building healthy soil and creating environments where insects can thrive, we let nature take its course, meaning we don’t need to rely on chemical pesticides.
Across our supply chain, we work with scientists, NGOs, and our model farms in Germany and Poland to actively protect and promote nature. Our farms don’t just grow ingredients, they support entire ecosystems.
At HiPP, biodiversity isn’t a box to tick — it’s a vital part of the way we farm, today and for the future.
Some of the practices we undertake to promote biodiversity include:



Farming with kindness and care
At HiPP, we believe that treating animals with care and respect is fundamental to a healthy, sustainable food system. That’s why we follow species-appropriate farming practices, ensuring that every animal can live according to its natural needs, with the right space, environment, and conditions to thrive.
All our animal-based ingredients come from certified organic farms, where high welfare is built into every step - from how animals are fed to how they’re housed and cared for. We believe that when animals thrive, ecosystems do too.
We care deeply about every living thing in our ecosystem — from the soil beneath our feet to the animals we raise with respect. Why? Because it’s in our nature.
What animal welfare means at HiPP:
Free-range, organically fed animals with access to pasture and space to move.
No routine antibiotics, growth hormones, or GM feed.
Natural environments, including woodland grazing and shelter for birds, insects, and small animals.
Animal care integrated with landscape conservation, supporting biodiversity and forest health
Maternity leave for cows, giving them time to rest, recover and care for their calves.

Rhodochlora claushippi
Decades of efforts to foster sustainability by Claus Hipp, the Hipp family and the company as a whole received a very special acknowledgement from scientists at the Bavarian State Collection for Zoology in Munich (ZSM). With HiPP’s support, ZSM scientists were able to research butterflies in tropical South American regions. When they discovered a new form of emerald moth there, they named it after Claus Hipp. The ZSM’s new classification honors HiPP’s efforts to establish sustainable food production and protect biodiversity. Emerald moths are symbols of diversity. They can be found in every continent of the world and serve as indicator species for healthy natural environments. Rhodochlora claushippi is a new species to science. At HiPP, this emerald moth has a starring role as an emblem of sustainability.

HiPP Responsibility report
The HiPP responsibility report is part of a lengthy series of environmental and sustainability reports that impressively document the past three decades of sustainable development at HiPP, although sustainability has been integral to our company for far longer. In addition, our company’s history documents how sustainability-driven action has shaped HiPP from our very first product to our present day.


